

Kenya’s Trade Patterns Shift as US Export Market Gains Narrow Gap with Uganda

Kenya’s export earnings from the United States rose sharply in the latest destination figures, bringing the North American market close to Uganda, the country’s leading export destination.
The growth contrasts with declining earnings from Tanzania and the United Arab Emirates, highlighting divergent trends among Kenya’s established trading partners. According to Leading Economic Indicators, a Kenya National Bureau of Statistics (KNBS) report released in July 2026, export earnings from the United States rose from KSh37.25 billion in 2025 to KSh63.79 billion in 2026. This represents an increase of KSh26.54 billion, or approximately 71.2 per cent. Uganda retained the top position, although its earnings increased by a smaller margin, from KSh63.45 billion to KSh64.06 billion. The gap between the two markets narrowed from KSh26.20 billion in 2025 to just KSh270 million in 2026. 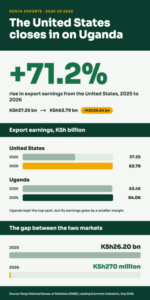
The movement places the United States among the most significant markets to watch as Kenya seeks to expand overseas sales. However, the reported figures do not identify which products drove the increase or whether the growth reflects higher shipment volumes, price changes, or a combination of factors.
Regional Markets Deliver Uneven Results
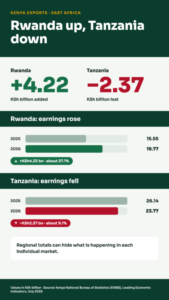
East African markets remained prominent in Kenya’s export trade, but the latest figures show performance varied across the region. Exports to Rwanda rose from KSh15.55 billion in 2025 to KSh19.77 billion in 2026, adding KSh4.22 billion in earnings. By contrast, exports to Tanzania fell from KSh26.14 billion to KSh23.77 billion, a decline of KSh2.37 billion, equivalent to approximately 9.1 per cent.
The contrasting results show why aggregate regional trade figures do not necessarily reflect individual market performance. While growth in Rwanda offers a positive signal for Kenyan exporters, the decline in Tanzania indicates weaker earnings from a neighbouring trading partner.
Egypt also rose, with export earnings increasing from KSh12.31 billion to KSh17.95 billion. The KSh5.64 billion gain represents growth of about 45.8 per cent, making Egypt another notable contributor to the positive movements among the listed destinations. These changes may help businesses decide where to focus export promotion and market development efforts. 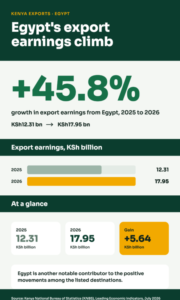
European Markets Post Modest Growth
Kenya recorded smaller increases in several European destinations. Exports to the Netherlands rose from KSh37.24 billion to KSh38.69 billion, while shipments to the United Kingdom increased from KSh30.68 billion to KSh31.76 billion. The Netherlands added KSh1.45 billion in export earnings, compared with KSh1.08 billion for the United Kingdom. Pakistan, another major destination in the comparison, rose from KSh36.79 billion to KSh38.86 billion.
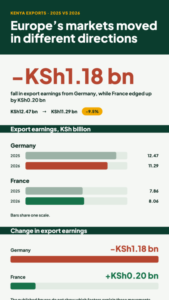
Not all European markets moved in the same direction. Germany’s export earnings fell from KSh12.47 billion to KSh11.29 billion, a reduction of KSh1.18 billion. France, meanwhile, recorded a modest increase from KSh7.86 billion to KSh8.06 billion. These differences suggest that Kenya’s export performance is not uniform across markets, even within the same broad geographical region. Changes in individual destinations may reflect different demand conditions, product composition, and commercial relationships, although the published figures do not show which factors explain the observed movements.
UAE Decline Stands Out
The United Arab Emirates recorded one of the largest contractions among the destinations listed. Export earnings fell from KSh31.49 billion in 2025 to KSh21.95 billion in 2026, a decrease of KSh9.54 billion, or about 30.3 per cent. 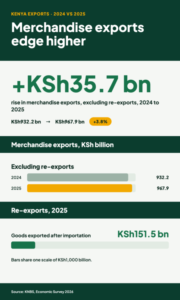
The decline is significant in absolute terms, exceeding the reductions recorded in Tanzania and Germany. However, the figures do not indicate whether specific commodities drove the movement or whether broader changes in trade were responsible.
KNBS’s Economic Survey 2026 reported that Kenya’s merchandise exports, excluding re-exports, rose from KSh932.2 billion in 2024 to KSh967.9 billion in 2025. Re-exports, comprising goods exported after importation, totalled KSh151.5 billion in 2025.
This distinction matters when interpreting export performance because the survey reports domestic exports and re-exports separately. The survey also identified tea, cut flowers, vegetables and fruit, apparel, and unroasted coffee as among Kenya’s leading export categories in 2025.
Conclusion
The July 2026 report by the KNBS shows that annual figures and destination movements together underscore the importance of strengthening established markets while pursuing new opportunities. A sustained, comprehensive assessment of Kenya’s export performance will require consistent annual data showing destination earnings alongside the products shipped and the quantities shipped.